Vibration monitoring for asset health and process monitoring
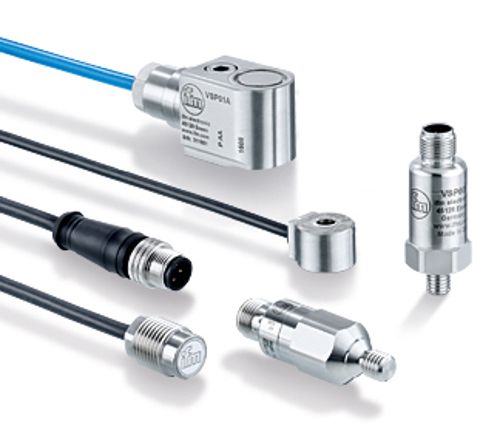
Choosing the right vibration monitoring hardware is important for ensuring the health and efficiency of your industrial machinery. With real-time visibility into machine conditions, you can address potential issues early, proactively plan maintenance activities, and ultimately maximize plant availability. Vibration monitoring allows you to not only detect problems before they become costly failures but also optimize your equipment processes through high-speed data analysis.
However, selecting the appropriate hardware depends on the complexity of your machinery and specific measurement goals. With decades of application experience, we categorize applications by machine type and recommend technologies that align with typical objectives.
From simple switches to programmable vibration controllers

Use the “Select by application” table below to narrow your search for a vibration sensor or system and read more about the underlying measuring principles and technology of a sensor group by finding the orange “Learn More” row.
| Machine classification | Application | Single-point measurement | Battery powered wireless | IO-Link | Programmable diagnostic electronics |
|
|---|---|---|---|---|---|---|
| VK / VT | VWV | VVB | VSE | |||
Type 1 - simple machines
|
|
 |
||||
Type 2 - process machines
|
High process forces
|
 |
||||
Very high process forces *
|
 |
|||||
Type 3 - complex machines
|
|
 |
*Use VVB only for process force monitoring
| Single-point measurement | Battery powered wireless | IO-Link | Programmable diagnostic electronics |
Accelerometer for VSE | |||||||
|---|---|---|---|---|---|---|---|---|---|---|---|
 |
 |
 |
 |
 |
 |
||||||
| VK | VT | VWV | VVB0 | VVB3 | VSE | VSA | VSM | VSP | |||
| Specficiations | |||||||||||
| Measuring range | 0...25 mm/s 0...50 mm/s |
-16...16 g | 0...50 g 0...45 mm/s |
0...16 g 0...300 mm/s |
- | -25...25 g -150...150 g -250...250 g |
-40...40 g | -50...50 g -80...80 g |
|||
| Frequency range | 10...1,000 Hz | 10...1,000 Hz | 2...10,000 Hz | 2...5,600 Hz | 0.1...12,000 Hz | 0...10,000 Hz | 0...4,500 Hz | 2...16,000 Hz | |||
| Temperature range | -25...80 C | -30...125 C | -30...80 C | -30...80 C | 0...60 C | -30...125 C | -30...85 C | -55...150 C | |||
| Inputs | - | - | - | 2 x 4...20 mA 4 x dynamic |
- | ||||||
| Outputs | 1 x normally closed 1 x 4...20 mA |
1 x 4...20 mA | - | 2 x digital outputs | 4 x digital 2 x digital 1 x 4...20 mA |
0...10 mA | mV/g | ||||
| Protocols | - | MQTT | IO-Link | TCP/IP, Profinet, E-IP, Ethercat, Modbus-TCP | - | IEPE | |||||
| # of measured axes | 1 | 1 or 3 | 1 | 3 | 4 | 1 | 2 or 3 | 1 | |||
| Protection class | IP 67 | IP 67; IP 68; IP 69K | IP 68 | IP 67; IP 68; IP 69K | IP 20; IP 67 | IP 67; IP 68; IP 69K | IP 67; IP 68; IP 69K | IP 67; IP 68 | |||
| Measurements | |||||||||||
| Acceleration peak (a-Peak) |
 |
|
 |
|
- | ||||||
| Avg. velocity (v-RMS) |
|
|
|
|
- | ||||||
| Avg. acceleration (a-RMS) |
|
|
|
|
- | ||||||
| Crest factor (a-Peak / a-RMS) |
|
|
|
|
- | ||||||
| Temperature | |
|
|
|
- | ||||||
 |
Simple switches and transmitters, Type VK, VT, and VWV | IO-Link vibration monitoring, Type VVB0 | 3-axis vibration monitorin with IO-Link, Type VVB3 | Programmable edge controller with accelerometer, Type VSE and VSx | |||||||

Equipment/Machine failures are usual gradual. Different status parameters can indicate a deterioration. Vibration condition monitoring opens up the ability to make predictions.
Vibration and friction are early indicators that occur long before a system or machine fails. Through active monitoring, potential damage can be detected weeks or even months in advance. In contrast, increased noise and heat are late-stage signs of failure, leaving little to no time for intervention if relied on.
Reactive maintenance
Reactive maintenance is a strategy where maintenance tasks are performed only after a failure has occurred. No preventive actions are taken. Maintenance work is only completed in reaction to a breakdown. While this strategy may be suitable in some cases, it is generally not cost-effective (high total cost of ownership).
Disadvantages:
- Long downtimes
- Higher repair costs
Preventative maintenance
Preventive maintenance consists of performing periodic maintenance tasks in a planned and scheduled manner regardless of whether a fault has occurred or not. The objective is to identify and fix potential problems early in order to minimise downtime. This can include inspecting, cleaning, lubricating or replacing parts. Maintenance schedules are usually recommended by manufacturers or based on historical data.
Disadvantages:
- Machine downtimes, even if not necessary
- Consumable parts not fully used
Condition-based maintenance
This strategy involves monitoring the current status of a system through the use of vibration sensors or other diagnostic tools. The data obtained can be used to determine maintenance requirements. Maintenance is performed only when the condition of the system meets or exceeds certain predefined criteria.
Advantages:
- Optimal use of resources
- Reduces unnecessary maintenance
Predictive maintenance
This strategy involves integrating advanced analytics with real-time sensor data to monitor equipment performance. By leveraging large datasets, manufacturers can train AI models to predict machine failures before they occur. This approach reduces downtime, identifies the root causes of degradation, and streamlines the process of issuing work orders.
Advantages:
- Provides actionable insights for planned repairs
- Reduces spare parts inventory
- Automates root cause analysis
- Enhances team expertise and operational understanding
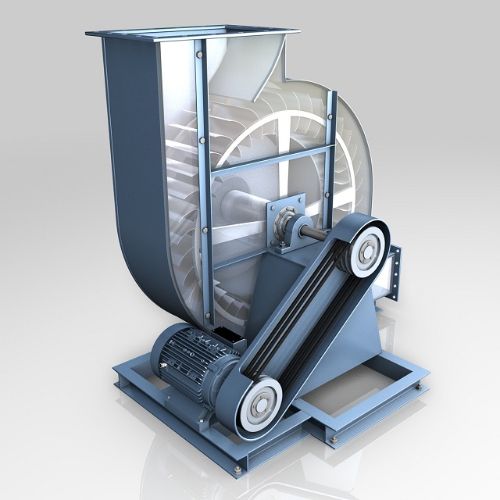
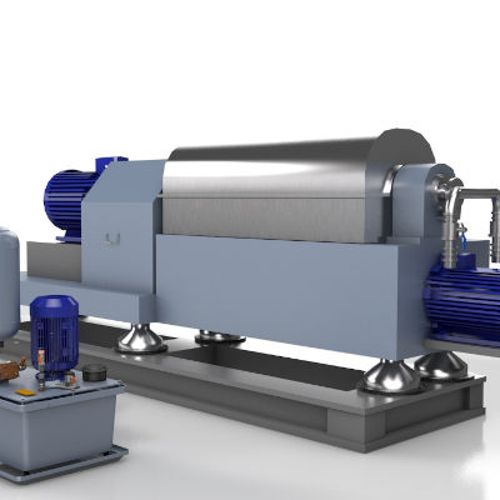
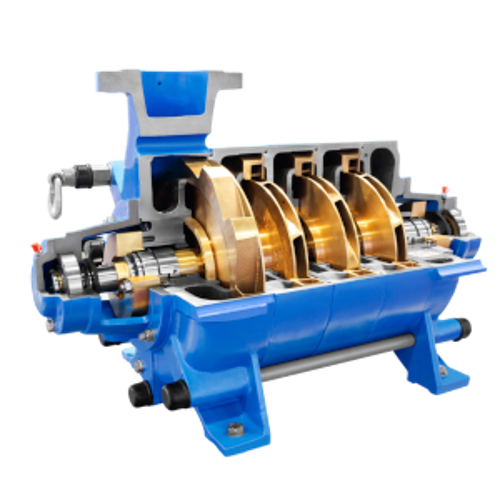
Expand the machines below to see the recommended mounting locations.
Typically, we recommend mounting sensors radially to the shaft rotation to detect the highest level of movement and positioning them as close to the target as possible. The orange dots in the images indicate the approximate sensor locations for smaller machines. If the mounting locations are more than 80 cm (30 inches) apart, we recommend adding additional sensors, as shown by the grey dots in the images.
Note: All sensors are capable of measuring all alarm conditions and identifying root causes.