- Supply Chain Management
- SAP-based software
- New Release 25.0
- Inventory Management
Highlight features from inventory management

Enhanced tools for superior inventory management and analysis
Release 25.0 offers numerous new features, buttons and views for an even better overview and even better management of your inventory in the ifm inventory management solution. Look forward to exciting news in the following areas:
FIORI APPS
REPLENISHMENT LEAD TIME (RLT)
TARGET WORKBENCH (TBW) & RULE WORKBENCH (RWB)
SAP S/4HANA
Fiori apps
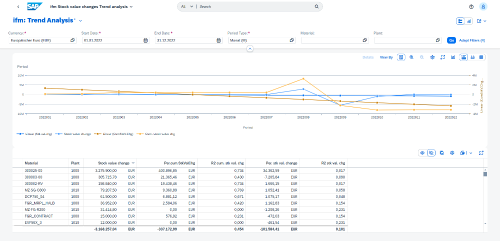
Our new app revolutionises stock analysis by providing you with precise insights into the trends and changes in your stock values. With a clear focus on business issues, it enables you to make informed decisions for efficient inventory management:
- Development over time: how have your stocks changed over a specific period?
- Growth or decline: has the stock increased or decreased, and to what extent?
- Average change: by how many euros does the stock value increase or decrease on average per period?
- Inventory drivers and reducers: which materials are the main contributors to inventory increases or reductions?
- Trend analysis: is inventory increasing or decreasing quickly or slowly?
This app not only gives you the facts but also an overview of the trends and dynamics of your stock values at all times – for strategic control that makes a difference.
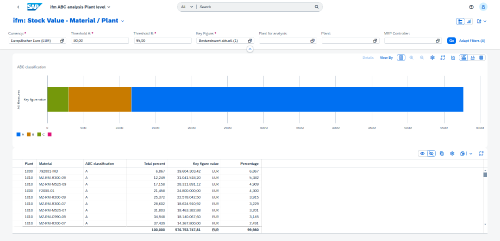
With our new ABC analysis app for SAP S/4HANA, we offer you a completely new perspective on your materials and their value. You get in-depth insights that go far beyond the classic ABC analysis:
- Valuable insights: which materials are the value drivers in a plant?
- Multi-plant analyses: what does the ABC distribution look like when several plants are considered at the same time?
- Individual material evaluation: how are your materials classified when you perform a targeted ABC analysis for your area of responsibility?
- Percentage stock distribution: how are the stock values distributed across your different product types?
- Alternative classification metrics: how does the ABC classification change when different metrics and periods are used?
This app takes analysis to a new level, providing precise data for your strategic decisions. With the flexibility to include different scenarios and data sources, your material and inventory planning will be more efficient and accurate than ever.
Case XYZ solved!
New app XYZ analysis at plant level
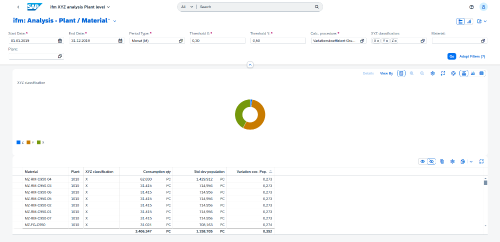
Our new XYZ analysis app provides you with precise insights into the classification of your materials. With a focus on variability and plannability, you get exactly the data you need to make informed decisions:
- Flexible selection: determine the materials you want to analyse and define the desired period.
- Precise analysis: find out how your materials are classified in the XYZ classification – from constant to irregular.
- Optimised planning: identify fluctuations and trends to align your inventory and procurement strategies even more efficiently.
This app makes variability analysis a breeze – ideal for agile and forward-thinking material planning.
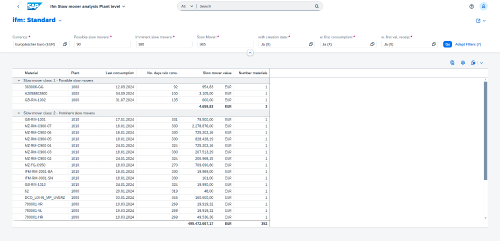
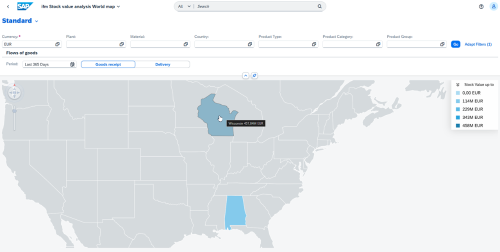
With our new slow-moving item analysis app, we are revolutionising the way we look at shelf stools. While our previous solution was static and only focused on existing slow-moving items, the new app goes a crucial step further:
- Identify impending slow-moving items: identify materials at an early stage that could soon become slow-moving items and take countermeasures in good time.
- Forward-looking analyses: find out which materials have the potential to become slow-moving items in the future and plan preventively.
- In-depth insights: keep track of existing slow-moving items and their values – broken down by product group, product type, division and other categories.
This forward-looking perspective not only allows you to manage existing issues but also to avoid future challenges. With the new slow-moving item analysis, you are always one step ahead and can optimise your stock levels in a targeted and cost-efficient manner.
RLT
The RLT BO[O]M experience!
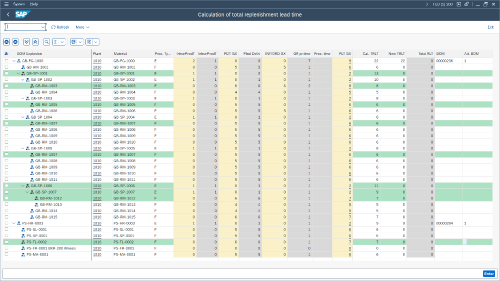
New TREE mode for BOM explosion
Discover more clarity with the new mode in the RLT BOM explosion. The TREE mode offers a structured visualisation of exploded BOMs and makes the critical path much more manageable. This clear presentation makes it possible to better understand the calculated total replenishment lead time (TRLT) based on the BOM.
In addition, the calculated TRLT and the new TRLT can be uniformly converted into working days or calendar days – for even more precise planning.
Target Workbench (TWB)
A clear view of the target-actual trend!
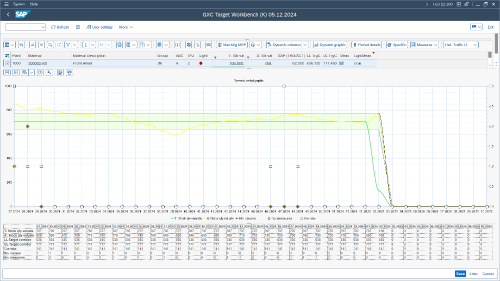
The enhanced dynamic graphic
The new dynamic graphic offers a clear and precise display of the target-actual comparison – supplemented by the additional display of a corridor. This makes the target-actual trend even more transparent and easier to understand. At the same time, the graphic shows how many causes and measures were recorded at which points in time, enabling a better assessment of the success of the measures.
The advanced user settings ensure maximum flexibility: decide for yourself whether you want to view the data in weeks or months and how many periods you want to display – perfectly tailored to your requirements.
More automation!
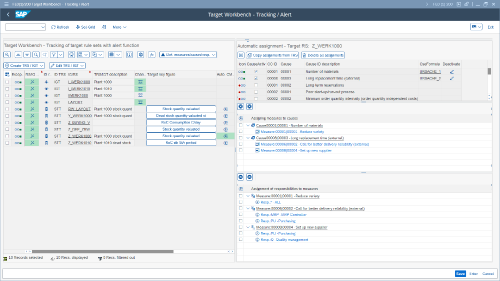
Automated assignment of causes, measures and responsibilities
Automate the assignment of causes, measures and responsibilities. With the new function, these can now be efficiently and automatically assigned using a formula in the TWB data structure.
In the TWB monitor, you can always identify automatically assigned causes, measures and responsibilities and, if necessary, adjust, delete or expand them.
This automation not only saves valuable time but also enables consistent and early identification of issues. This way, causes are identified directly and measures are quickly implemented to respond efficiently to challenges.
Rule Workbench (RWB)
A better overview, less distraction:
the new, simplified RWB mode
The new runtime optimisation takes data collection in the SAP S/4HANA system to a new level. Particularly in scenarios with a large number of special stocks, this function enables significantly faster and more targeted provision of the required data.
Thanks to optimised integration in SAP S/4HANA, relevant information is provided more precisely and in a more resource-efficient manner.
SAP S/4HANA
Speed up! More efficient data collection for special stocks.
Runtime optimisation in key figure setup for SAP S/4HANA
The new runtime optimisation takes data collection in the SAP S/4HANA system to a new level. This function enables significantly faster and more targeted provision of the required data, especially in scenarios with a large number of special stocks.
Thanks to optimised integration in SAP S/4HANA, relevant information can be accessed more precisely and with greater resource efficiency. The result: shorter loading times, lower system load and faster availability.
More comparability and future flexibility:
alternative consumption calculation under SAP S/4HANA
With the new function for alternative consumption calculation under SAP S/4HANA, we offer you the option of using the SAP standard consumption directly as a basis. This creates a uniform basis for key figures and analyses, which is particularly advantageous when comparing with the SAP standard.
However, not every setting is suitable for every scenario. In specific cases, such as stock optimisation, deviations from the standard values may be more appropriate. That is why we are looking forward: in the future, we will offer full flexibility to choose between the SAP standard, a customised solution or an own interpretation. This way, you can always use the method that best suits your company's requirements.
This development allows you to control your processes even better while fully exploiting the advantages of the SAP standard in terms of comparability and transparency.
